The following table shows total assets ($ billion) for a small sample of U.S.banks in the 4th quarter of 2018. 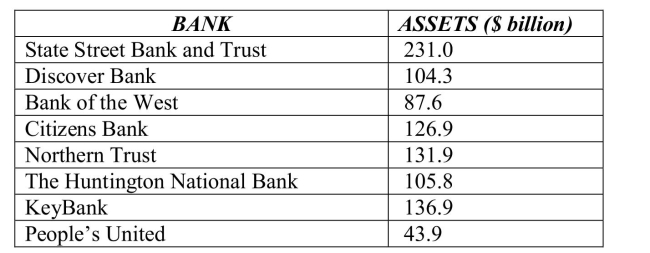 The standard deviation for these data is
A) $ 53.55 billion.
B) $ 100.35 billion.
C) $ 75.68 billion.
D) $ 84.21 billion.
E) $ 89.79 billion.
Correct Answer:
Verified
Q1: The following table shows representative recent
Q2: The following table shows representative recent
Q4: Below is a histogram of salaries (in
Q5: A automobile marketing firm conducts a
Q6: Below is a histogram of salaries (in
Q7: A restaurant uses comment cards to
Q8: Consider the five number summary of
Q9: Consider the five number summary of
Q10: Consider the five number summary of
Q11: A clothing store uses comment cards
Unlock this Answer For Free Now!
View this answer and more for free by performing one of the following actions

Scan the QR code to install the App and get 2 free unlocks

Unlock quizzes for free by uploading documents