This figure illustrating coarticulation in consonant production shows the schematic spectrograms for /di/ and /du/. The second formant for the vowel /i/ has much higher frequency than that for the vowel /u/. The transition from /d/ to the second formant of the vowel has a high and rising profile for /di/ and a low and declining profile for /du/. However, one perceives the /d/ as sounding the same in the two syllables. This is an example of: 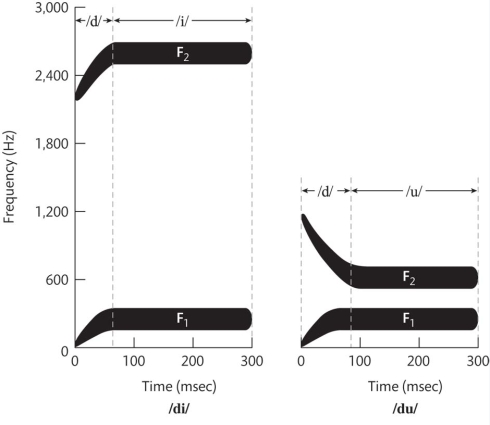
A) harmonicity.
B) perceptual constancy.
C) categorical perception.
D) the McGurk effect.
Correct Answer:
Verified
Q8: Formants are the frequency bands with:
A) relatively
Q9: In the context of voicing, when the
Q10: In the human vocal apparatus, the _
Q11: In the word rhyme, the letters h
Q12: In the production of consonant sounds, _
Q14: In the production of consonants, the nature
Q15: According to the patterns of articulation for
Q16: According to investigations based on the precise
Q17: The fundamental frequency of vocal fold vibration
Q18: The International Phonetic Alphabet:
A) represents a simple
Unlock this Answer For Free Now!
View this answer and more for free by performing one of the following actions

Scan the QR code to install the App and get 2 free unlocks

Unlock quizzes for free by uploading documents