What is illustrated by this figure? 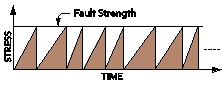
A) stress consistently increases through time
B) stress consistently decreases through time
C) as stress increases, the fault strength increases
D) stress increases until it matches the strength of the fault, and then stress decreases
Correct Answer:
Verified
Q7: What do the two stars near the
Q8: When do rocks along a fault have
Q9: An earthquake generated on this type of
Q10: Earthquakes may be caused by:
A) movement along
Q11: On this map of southeastern Asia and
Q13: What is true about the earthquakes on
Q14: The image shows a surface expression of
Q15: Which of the following is NOT a
Q16: Which area did NOT have casualties caused
Q17: The fault scarp in this photograph apparently
Unlock this Answer For Free Now!
View this answer and more for free by performing one of the following actions

Scan the QR code to install the App and get 2 free unlocks

Unlock quizzes for free by uploading documents