The following frequency distribution presents the frequency of passenger vehicles that pass through a certain intersection from 8:00 AM to 9:00 AM on a particular day. 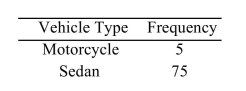
Construct a frequency bar graph for the data.
A) 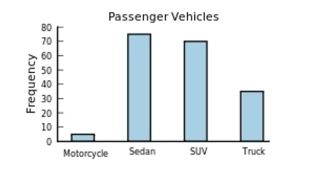
B) 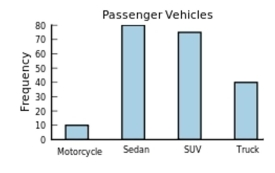
C) 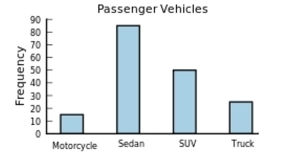
D) 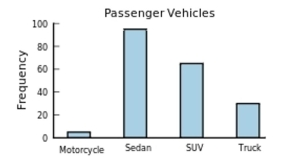
Correct Answer:
Verified
Q1: The following table presents the purchase
Q2: The following frequency distribution presents the
Q3: Classify the histogram as skewed to the
Q4: The following table presents the purchase
Q5: The following frequency distribution presents the
Q7: The following frequency distribution presents the
Q8: One hundred students are shown an eight-digit
Q9: The following bar graph presents the average
Q10: The following pie chart presents the percentages
Q11: The following table presents the purchase
Unlock this Answer For Free Now!
View this answer and more for free by performing one of the following actions

Scan the QR code to install the App and get 2 free unlocks

Unlock quizzes for free by uploading documents