Thirty households were surveyed for the number of televisions in each home. Following are the results.
Construct a relative frequency histogram.
A) 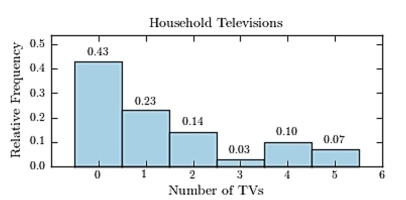
B) 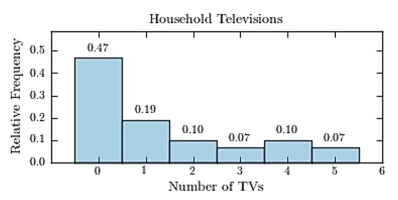
C) 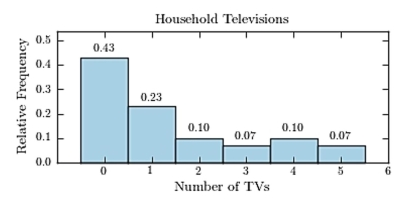
D) 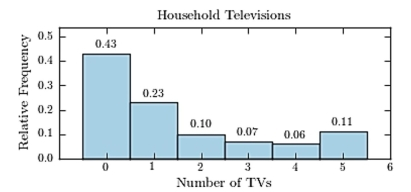
Correct Answer:
Verified
Q21: The amounts 5 and 2 are compared.
Q22: A sample of 200 high school
Q23: Following are the numbers of Dean's
Q24: Construct a stem-and-leaf plot for the
Q25: Gravity on Mars: The gravity on Earth
Q27: Construct a dotplot for the following
Q28: A sample of 200 high school
Q29: The following time-series plot presents the population
Q30: Helium prices: The cost of grade A
Q31: A sample of 200 high school
Unlock this Answer For Free Now!
View this answer and more for free by performing one of the following actions

Scan the QR code to install the App and get 2 free unlocks

Unlock quizzes for free by uploading documents