The following table shows the weekly total sales (in dollars) at a small roadside vegetable stand for the months June through September. 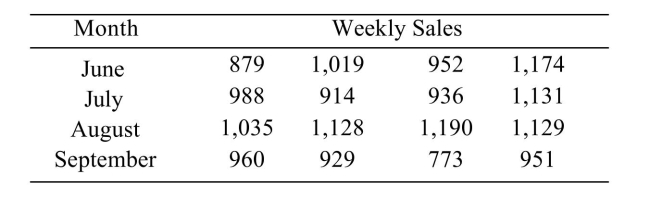 Perform a Tukey-Kramer test to determine which pairs of means, if any, differ. Use the level of Significance.
A)
B)
C)
D) There is not enough evidence to conclude that any of the means differ.
Correct Answer:
Verified
Q10: Samples were drawn from three populations.
Q11: Samples were drawn from three populations.
Q12: In a one-way ANOVA, the following data
Q13: The following table shows the weekly
Q14: Samples were drawn from three populations.
Q16: In a one-way ANOVA, the following data
Q17: In a one-way ANOVA, the following data
Q18: In a one-way ANOVA, the following data
Q19: Samples were drawn from three populations.
Q20: In a one-way ANOVA, the following data
Unlock this Answer For Free Now!
View this answer and more for free by performing one of the following actions

Scan the QR code to install the App and get 2 free unlocks

Unlock quizzes for free by uploading documents