By Columns By Rows
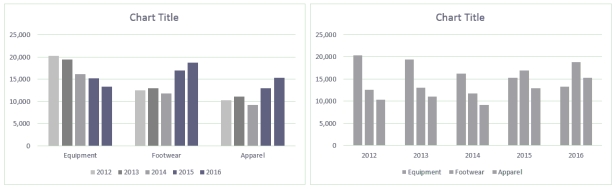
Ross always looks at data in more than one way. He discovered a feature in Excel that allows him to display the chart By Column and By Rows, as shown in the above figure.
-When the chart is plotted by columns, what information does it emphasize?
A) comparing the amount of each year's sales for each of the three categories
B) the contribution that each category made to each year's performance
C) the percentage of total sales that each of the three categories make up
D) none of the above
Correct Answer:
Verified
Q96: The _ trendline is used to smooth
Q97: The _ chart sub-type adds information on
Q98: One of the features of 100% stacked
Q99: Using the _ in a chart is
Q100: In a scatter chart and a bubble
Q102: The _ chart type displays value trends
Q103: The _ gallery in the Insert Shapes
Q104: _ got their name because they display
Q105: By Columns By Rows Q106: Case-Based Critical Thinking Questions
![]()
Case 3-1

Unlock this Answer For Free Now!
View this answer and more for free by performing one of the following actions

Scan the QR code to install the App and get 2 free unlocks

Unlock quizzes for free by uploading documents