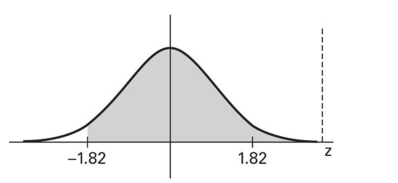
Find the area of the shaded region. The graph depicts the standard normal distribution with mean 0 and standard deviation 1. 
A) 0.0344
B) 0.4656
C) -0.0344
D) 0.9656
Correct Answer:
Verified
Q12: If a histogram of a sample of
Q12: Find the probability that in 200 tosses
Q13: A study of the amount of time
Q14: The distribution of certain test scores
Q16: Estimate the indicated probability by using
Q18: The lengths of human pregnancies are normally
Q19: Assume that
Q20: For the binomial distribution with
Q21: Find the area of the shaded region.
Q22: An unbiased estimator is a statistic that
Unlock this Answer For Free Now!
View this answer and more for free by performing one of the following actions

Scan the QR code to install the App and get 2 free unlocks

Unlock quizzes for free by uploading documents