Construct a boxplot for the given data. Include values of the 5-number summary in all boxplots.
-Describe any similarities or differences in the two distributions represented by the following boxplots. Assume
the two boxplots have the same scale. 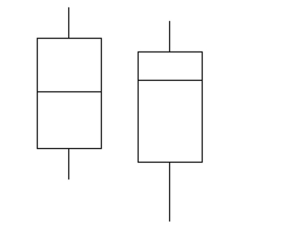
Correct Answer:
Verified
Q141: Provide an appropriate response.
-Heights of adult women
Q198: Find the z-score corresponding to the given
Q199: Find the percentile for the data
Q200: Find the number of standard deviations from
Q201: Find the indicated measure.
-The test scores of
Q202: Find the indicated measure.
-The weights (in
Q204: Find the indicated measure.
-The test scores
Q205: Construct a boxplot for the given data.
Q206: Construct a boxplot for the given
Q208: Construct a boxplot for the given
Unlock this Answer For Free Now!
View this answer and more for free by performing one of the following actions

Scan the QR code to install the App and get 2 free unlocks

Unlock quizzes for free by uploading documents