Wagenlucht Ice Cream Company is always trying to create new flavors of ice cream. They are market testing three kinds to find out which one has the best chance of becoming popular. They give small samples of each to
20 people at a grocery store. Four ice cream tasters preferred the Strawberry Cream, 12 preferred Choco-Nuts, And four loved the Orange Mint. Construct a Pareto chart to represent these preferences. Choose the vertical Scale so that the relative frequencies are represented.
A) 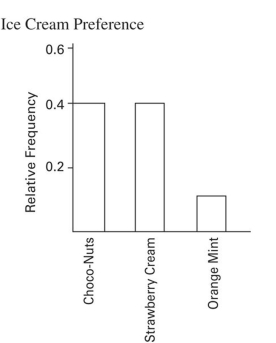
B) 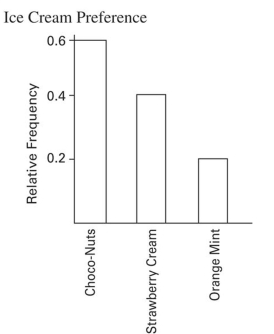
C) 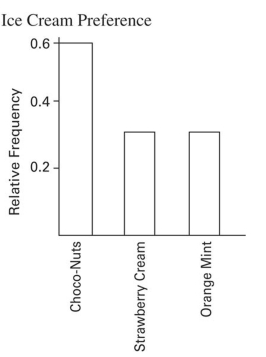
D) 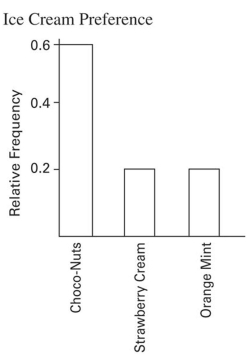
Correct Answer:
Verified
Q27: According to USA Today, the largest categories
Q28: The frequency distribution below summarizes employee
Q29: Smoking and the episodes of lung cancer
Q30: The linear _ coefficient denoted by r
Q31: Attendance records at a school show
Q33: A manufacturer records the number of
Q34: A nurse measured the blood pressure of
Q35: The following frequency distribution depicts the
Q36: Identify the cumulative frequency distribution that
Q37: The histogram below represents the number of
Unlock this Answer For Free Now!
View this answer and more for free by performing one of the following actions

Scan the QR code to install the App and get 2 free unlocks

Unlock quizzes for free by uploading documents