The histogram below represents the number of television sets per household for a sample of U.S. households. How many households are included in the histogram? 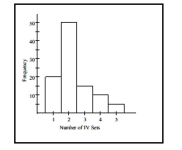
A) 95
B) 110
C) 90
D) 100
Correct Answer:
Verified
Q76: Q77: The frequency distribution below summarizes employee Q78: The frequency distribution below summarizes the Q79: The frequency distribution below summarizes the Q80: The frequency distribution below summarizes employee Q82: In a survey, 20 people were Q83: The histogram below represents the number of Q84: A nurse measured the blood pressure of Q85: Consider the frequency distribution below, which Q86: The frequency table below shows the
Unlock this Answer For Free Now!
View this answer and more for free by performing one of the following actions

Scan the QR code to install the App and get 2 free unlocks

Unlock quizzes for free by uploading documents