The histogram below represents the number of television sets per household for a sample of U.S. households. What is the class width? 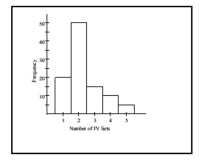
A) 5
B) 0.5
C) 1
D) 2
Correct Answer:
Verified
Q35: Solve the problem.
-Suppose that you construct a
Q40: Solve the problem.
-Construct a frequency distribution and
Q91: Sturges' guideline suggests that when constructing a
Q92: Suppose that a histogram is constructed
Q93: The histogram below shows the distribution of
Q94: In a survey, 26 voters were
Q95: A nurse measured the blood pressure of
Q97: The following figures represent Jennifer's monthly
Q99: A school district performed a study
Q101: A store manager counts the number of
Unlock this Answer For Free Now!
View this answer and more for free by performing one of the following actions

Scan the QR code to install the App and get 2 free unlocks

Unlock quizzes for free by uploading documents