Construct a pie chart representing the given data set.
-A parcel delivery service lowered its prices and finds that it has delivered twice as many parcels this year as it
did last year. To illustrate this fact, the manager draws a graph as shown below. Each cube depicts a parcel. The
side length of the "parcel" on the right is twice the side length of the "parcel" on the left. Why is this graph
misleading? What visual impression is created by the graph? 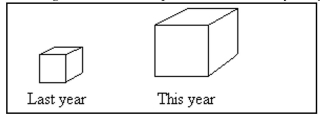
Correct Answer:
Verified
View Answer
Unlock this answer now
Get Access to more Verified Answers free of charge
Q122: Construct a pie chart representing the given
Q123: Construct a pie chart representing the
Q124: Solve the problem.
-A car dealer is
Q125: Construct a pie chart representing the
Q126: Construct a pie chart representing the
Q127: Construct a pie chart representing the given
Q128: Solve the problem.
-At the National Criminologists
Q130: Construct a pie chart representing the
Q131: Construct a pie chart representing the given
Q132: Construct a pie chart representing the given
Unlock this Answer For Free Now!
View this answer and more for free by performing one of the following actions

Scan the QR code to install the App and get 2 free unlocks

Unlock quizzes for free by uploading documents