Construct a run chart for individual values corresponding to the given data. A machine is supposed to fill boxes
to a weight of 50 pounds. Every 30 minutes a sample of four boxes is tested; the results are given below. 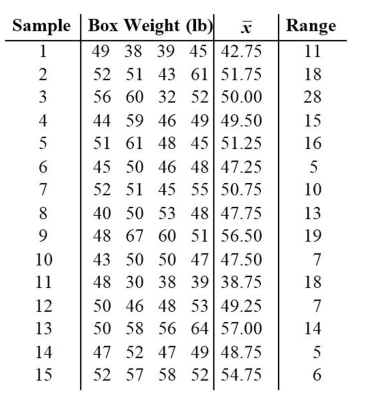
Correct Answer:
Verified
Q8: Are control charts based on actual behavior
Q10: Describe the three criteria used to determine
Q12: Use the given process data to
Q13: A control chart for
Q13: Provide an appropriate response. Describe what process
Q14: Examine the given run chart or control
Q16: Examine the given run chart or control
Q17: Use the given process data to
Q18: Describe a run chart and give an
Q19:
Unlock this Answer For Free Now!
View this answer and more for free by performing one of the following actions

Scan the QR code to install the App and get 2 free unlocks

Unlock quizzes for free by uploading documents