A run chart for individual values is shown below. Does there appear to be a pattern suggesting that the process
is not within statistical control? If so, describe the pattern. 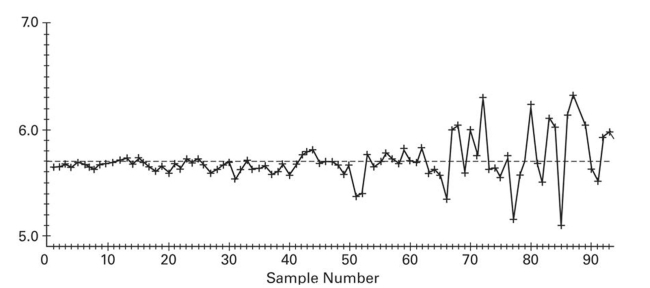
Correct Answer:
Verified
View Answer
Unlock this answer now
Get Access to more Verified Answers free of charge
Q6: Define statistically stable (or "within statistical control").
Q10: Describe the three criteria used to determine
Q29: Construct an R chart and determine whether
Q30: Construct a run chart for individual values
Q31: Control charts are used to monitor changing
Unlock this Answer For Free Now!
View this answer and more for free by performing one of the following actions

Scan the QR code to install the App and get 2 free unlocks

Unlock quizzes for free by uploading documents