The following table gives the US domestic oil production rates (excluding Alaska) from 1987 to 2002. A
regression equation was fit to the data and the residual plot is shown below. 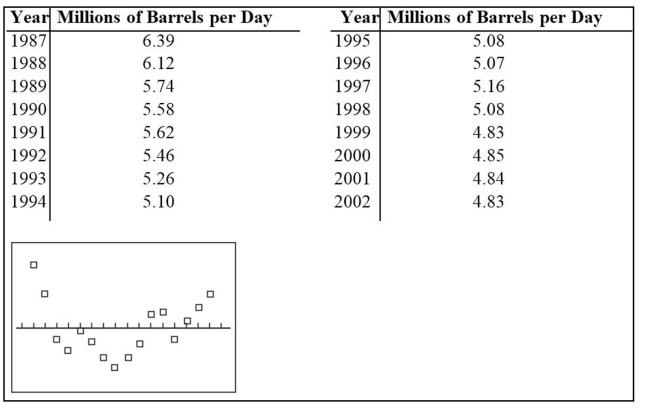 Does the residual plot suggest that the regression equation is a bad model? Why or why not?
Correct Answer:
Verified
View Answer
Unlock this answer now
Get Access to more Verified Answers free of charge
Q42: Applicants for a particular job, which
Q43: For each of 200 randomly selected cities,
Q45: The table lists the value y
Q45: Give an example of a pair of
Q46: Suppose there is significant correlation between two
Unlock this Answer For Free Now!
View this answer and more for free by performing one of the following actions

Scan the QR code to install the App and get 2 free unlocks

Unlock quizzes for free by uploading documents