Nine adults were selected at random from among those working full time in the town of Workington.
Each person was asked the number of years of college education they had completed and was also asked to rate
their job satisfaction on a scale of 1 to 10.
The pairs of data values area plotted in the scatterplot below. 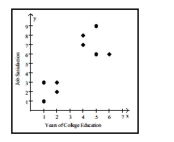 The four points in the lower left corner correspond to employees from company A and the five points in the
upper right corner correspond to employees from company B.
a. Using the pairs of values for all 9 points, find the equation of the regression line.
b. Using only the pairs of values for the four points in the lower left corner, find the equation of the regression
line.
c. Using only the pairs of values for the five points in the upper right corner, find the equation of the regression
line.
d. Compare the results from parts a, b, and c.
Correct Answer:
Verified
b.
c.
d. The results are...
View Answer
Unlock this answer now
Get Access to more Verified Answers free of charge
Q99: Suppose you will perform a test
Q100: Use the given data to find
Q101: The following residual plot is obtained after
Q102: Is the data point, P, an outlier,
Q103: The sample data below are the
Q105: Use the given data to find
Q106: Applicants for a particular job, which
Q107: Use the given data to find
Q108: Use the given data to find
Q109: The following residual plot is obtained after
Unlock this Answer For Free Now!
View this answer and more for free by performing one of the following actions

Scan the QR code to install the App and get 2 free unlocks

Unlock quizzes for free by uploading documents