The following table gives the US domestic oil production rates (excluding Alaska) over the past few years. A
regression equation was fit to the data and the residual plot is shown below. 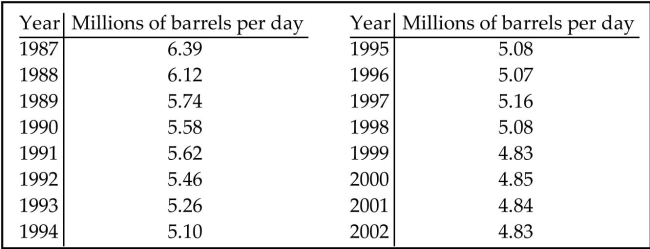
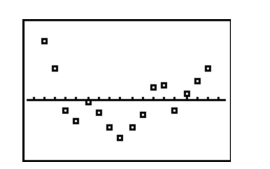 Does the residual plot suggest that the regression equation is a bad model? Why or why not?
Correct Answer:
Verified
View Answer
Unlock this answer now
Get Access to more Verified Answers free of charge
Q107: Use the given data to find
Q108: Use the given data to find
Q109: The following residual plot is obtained after
Q110: Use the given data to find
Q111: Use the given data to find
Q113: For the data below, determine the
Q114: Is the data point, P, an outlier,
Q115: Is the data point, P, an
Q116: Use the given data to find
Q117: Use the given data to find
Unlock this Answer For Free Now!
View this answer and more for free by performing one of the following actions

Scan the QR code to install the App and get 2 free unlocks

Unlock quizzes for free by uploading documents