Based on the regression output and residual plot below, which of the following is true?
Regression Analysis: Technology Adoption versus Time
Technology Adoption = - 11.9 +
3) 37 Time
S = 6.30783 R-Sq = 82.5%
The regression equation is: 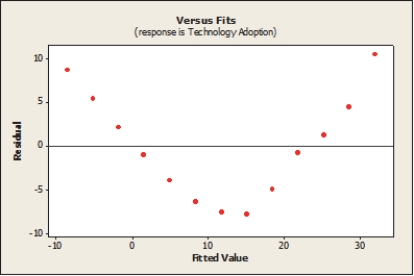 Durbin-Watson statistic = 0.278634
A) The linear model explains 82.5 % of the variability in technology adoption.
B) The linear model is appropriate.
C) The linear model is not appropriate.
D) Both A and B.
E) Both A and C.
Correct Answer:
Verified
Q1: According to the output below, which
Q2: Data were collected for a sample of
Q3: In a regression analysis predicting tourism revenue
Q4: According to the results below, what
Q6: From the plots of residuals shown below,
Q7: According to the partial regression analysis
Q8: Regression analysis was performed to develop a
Q9: Data were collected for a sample of
Q10: Using this regression equation: Salary =
Q11: According to the regression analysis output
Unlock this Answer For Free Now!
View this answer and more for free by performing one of the following actions

Scan the QR code to install the App and get 2 free unlocks

Unlock quizzes for free by uploading documents