Use the following information for problems
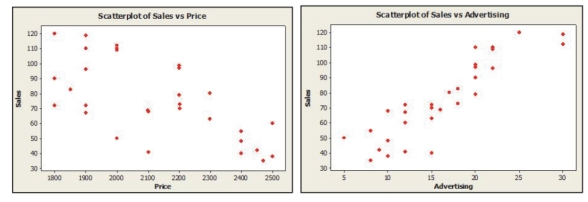
Sales figures (number of units), selling price and amount spent on advertising (as a percentage of total advertising expenditure in the previous quarter) for the popular Sony Bravia Television were obtained for last quarter from a sample of 30 different stores. The results of a multiple regression are presented below. Dependent Variable Sales
Analyaia of Variance
-Use the F-test to determine whether the slope coefficients are significantly different
from 0. Write the null and alternative hypotheses and calculate the F-statistic.
Correct Answer:
Verified
View Answer
Unlock this answer now
Get Access to more Verified Answers free of charge
Q6: Use the following information for problems
Q7: Use the following information for problems
Q8: Use the following information for problems
Q9: A sample of 33 companies was
Q10: A sample of 33 companies was
Q12: Use the following information for problems
Q13: Use the following information for problems
Q14: A sample of 33 companies was
Q15: Use the following information for problems
Q16: Use the following information for problems
Unlock this Answer For Free Now!
View this answer and more for free by performing one of the following actions

Scan the QR code to install the App and get 2 free unlocks

Unlock quizzes for free by uploading documents