After the financial crisis of 2007/2008, the Dow Jones Industrial Average (DJIA) improved from a low of 7278 on March 20, 2009, to new records just a few years later.
On August 8, 2011, the Dow dropped 634.8 points. A histogram of day-to-day changes in
The DJIA looked like the histogram below. An accurate description of the distribution of
Changes in the DJIA is 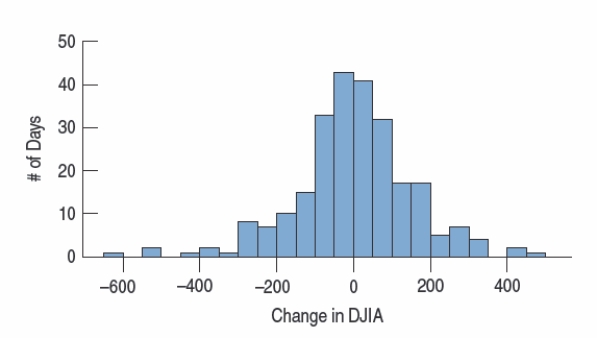
A) The distribution is fairly symmetric.
B) The distribution is somewhat left skewed with a number of low outliers.
C) A normal probability plot would add information about the normality of the data
Set)
D) Both A and C
E) Both B and C
Correct Answer:
Verified
Q7: Which is true about a 99% confidence
Q8: A researcher is conducting a study on
Q9: A government agency has 6000 employees.
Q10: A manufacturer of batteries routinely tests its
Q11: Assume that a set of test scores
Q13: Nine out of 25 randomly selected Students
Q14: IT staff for a large corporation has
Q15: An advocacy group is investigating whether
Q16: Which is true about a 90% confidence
Q20: A human resources manager at a large
Unlock this Answer For Free Now!
View this answer and more for free by performing one of the following actions

Scan the QR code to install the App and get 2 free unlocks

Unlock quizzes for free by uploading documents