Following is a histogram of salaries (in $) for a sample of U.S. marketing managers.
Comment on the shape of the distribution. 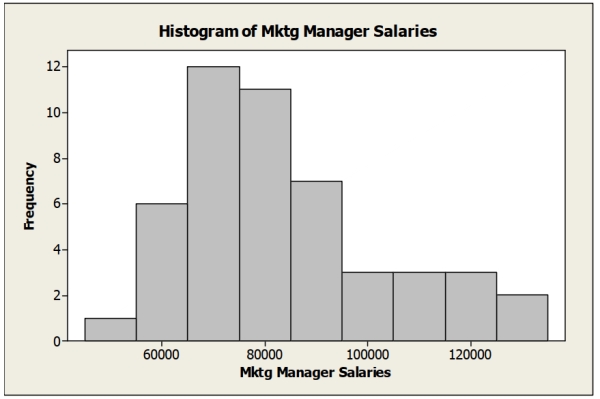
Correct Answer:
Verified
Q2: Suppose the marketing manager who was earning
Q3: The following table shows data on
Q4: The following table shows representative recent
Q5: The following table shows representative recent
Q6: The following boxplots show monthly sales revenue
Q8: The following table shows representative recent
Q9: For the data on total assets ($
Q10: The following boxplots show monthly sales revenue
Q11: Below is a histogram of salaries (in
Q12: Following is the five number summary
Unlock this Answer For Free Now!
View this answer and more for free by performing one of the following actions

Scan the QR code to install the App and get 2 free unlocks

Unlock quizzes for free by uploading documents