The following is a bar chart summarizing consumer preferences for various brands of digital cameras. 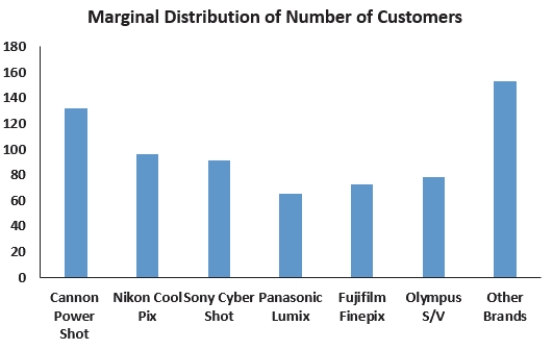 This bar chart shows
A) the marginal distribution of brands.
B) the conditional distribution of brands.
C) the contingency distribution of brands.
D) the distribution for a quantitative variable.
E) none of the above.
Correct Answer:
Verified
Q3: Find each of the following percentages.
A. What
Q3: Consider the following to answer the question(s)
Q4: Find each of the following percentages. a.
Q4: Consider the following to answer the question(s)
Q9: A large national retailer of electronics
Q10: A automobile marketing firm conducts a
Q11: Consider the following to answer the question(s)
Q12: Consider the following side by side bar
Q61: A research company frequently monitors trends
Q61: A research company frequently monitors trends
Unlock this Answer For Free Now!
View this answer and more for free by performing one of the following actions

Scan the QR code to install the App and get 2 free unlocks

Unlock quizzes for free by uploading documents