Linear regression was used to describe the trend in world population over time. Below is a plot of the residuals versus predicted values.What does the plot of residuals
Suggest? 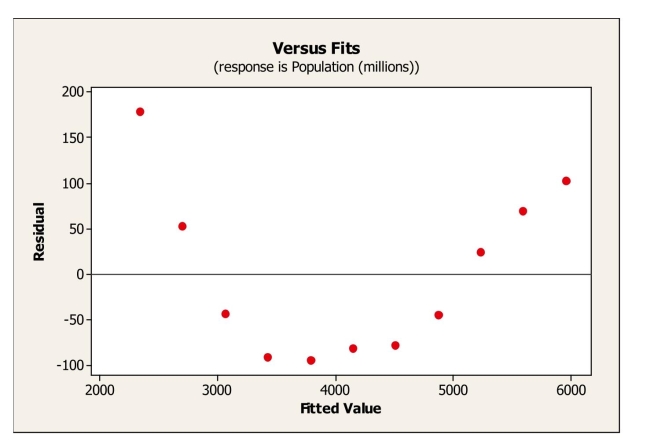
A) An outlier is present in the data set.
B) The linearity condition is not satisfied.
C) A high leverage point is present in the data set.
D) The data are not normal.
E) The equal spread condition is not satisfied.
Correct Answer:
Verified
Q2: Suppose the correlation, r, between two variables
Q10: Suppose the correlation, r, between two variables
Q12: Consider the following to answer the question(s)
Q13: For each of the following scenarios, indicate
Q15: Data were collected on monthly sales revenues
Q18: A small independent organic food store offers
Q18: Consider the following to answer the question(s)
Q19: A company studying the productivity of their
Q23: For the following scatterplot, Q24: Based on the following residual plot, which![]()
Unlock this Answer For Free Now!
View this answer and more for free by performing one of the following actions

Scan the QR code to install the App and get 2 free unlocks

Unlock quizzes for free by uploading documents