Here is a pie chart for data collected about clients of brokerage firm. 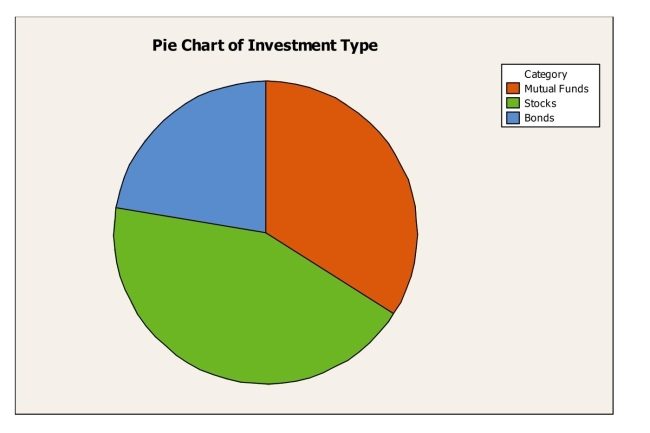 The pie chart shows
A) the distribution of a quantitative variable.
B) the contingency distribution of investment type.
C) the conditional distribution of investment type.
D) the marginal distribution of investment type.
E) the joint distribution of investment type.
Correct Answer:
Verified
Q22: A full service brokerage firm gathered information
Q23: A full service brokerage firm gathered information
Q24: A regional survey was carried out to
Q25: A regional survey was carried out to
Q28: A restaurant uses comment cards to get
Q29: A regional survey was carried out to
Q30: A restaurant uses comment cards to get
Q31: A regional survey was carried out to
Q32: In May, 2010, the Pew Research Center
Q32: A regional survey was carried out to
Unlock this Answer For Free Now!
View this answer and more for free by performing one of the following actions

Scan the QR code to install the App and get 2 free unlocks

Unlock quizzes for free by uploading documents