The following distribution table represents preferences for two types of cereals by 2,000 boys and
Girls. 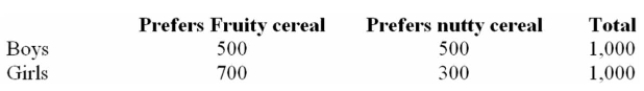
Find the probability that a person prefers Fruity cereal given that the person is a boy.
A) 500/1,000
B) 500/2,000
C) 1,200/2,000
D) 500/1,200
Correct Answer:
Verified
Q43: An automatic machine inserts mixed vegetables into
Q44: A study by Tourism Ontario revealed that
Q45: The following distribution table represents preferences for
Q46: i. A coin is tossed four times.
Q47: Each salesperson in a large department store
Q49: A study of the opinion of designers
Q50: A tire manufacturer advertises, "the median life
Q51: The following distribution table represents preferences for
Q52: A group of employees of Unique Services
Q69: If two events are independent,then their joint
Unlock this Answer For Free Now!
View this answer and more for free by performing one of the following actions

Scan the QR code to install the App and get 2 free unlocks

Unlock quizzes for free by uploading documents