Listed below is the box plot of average earnings ratio for full-year, full-time female workers from
1999 to 2008. 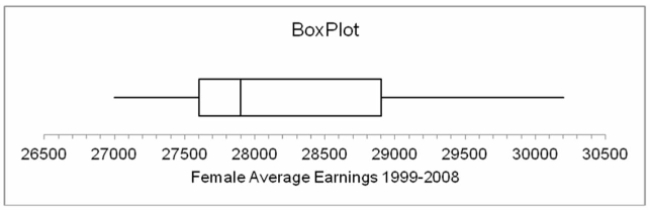
From this we can interpret that the distribution of average earnings for women for the years 1999-
2008 was:
A) Symmetrical
B) Positively skewed
C) Negatively skewed
D) Bimodal
E) Variable
Correct Answer:
Verified
Q123: The printout below is a summary of
Q124: Listed below is the box plot of
Q125: Listed below is the box plot of
Q126: Listed below is the box plot of
Q127: Determine the age of the oldest person
Q129: A large group of inductees was given
Q130: What is the size of the sample?
A)
Q131: Determine the age of the youngest person
Q132: The printout below is a summary of
Q133: Listed below is the box plot of
Unlock this Answer For Free Now!
View this answer and more for free by performing one of the following actions

Scan the QR code to install the App and get 2 free unlocks

Unlock quizzes for free by uploading documents