Listed below is the net sales in $ million for Home Depot Inc., and its subsidiaries from 1994 to
2003. 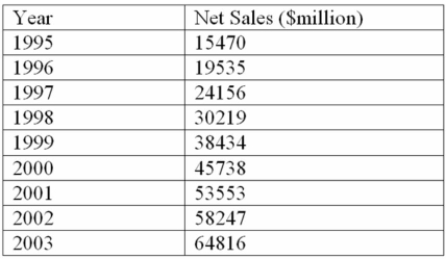
Using the printout below, what are the estimated sales for 2004? 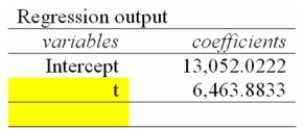
A) $90,618.6 Million
B) $77,690.9 Million
C) $84,154.7 Million
D) $103,546.4 Million
E) $71,227.0 Million
Correct Answer:
Verified
Q48: Given the trend equation ŷ = 25
Q89: i. In a time series analysis, the
Q90: For a time series beginning with 1988
Q91: i. In the linear trend equation, t
Q92: i. In the linear trend equation, the
Q93: i. In the linear trend equation, t
Q95: If you have annual data for 1991
Q97: A linear trend equation is used to
Q98: i. In a time series analysis, the
Q99: In the linear trend equation, how is
Unlock this Answer For Free Now!
View this answer and more for free by performing one of the following actions

Scan the QR code to install the App and get 2 free unlocks

Unlock quizzes for free by uploading documents