Listed below is the net sales in $ million for Home Depot Inc., and its subsidiaries from 1994 to
2003. 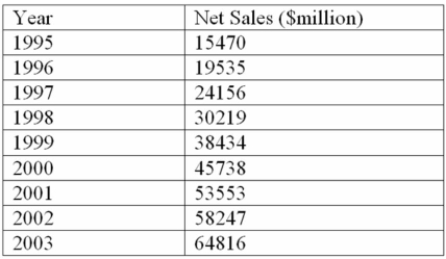
Using the printout below, what are the estimated sales for 2005? 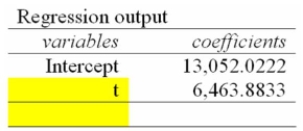
A) $90,618.6 Million
B) $77,690.9 Million
C) $84,154.7 Million
D) $103,546.4 Million
E) $71,227.0 Million
Correct Answer:
Verified
Q97: A linear trend equation is used to
Q98: i. In a time series analysis, the
Q99: In the linear trend equation, how is
Q100: What is a disadvantage of estimating a
Q101: How will data which increases (or decreases)
Q103: What is the forecast for year 9?
Q104: A logarithmic straight-line trend equation should be
Q105: What is Log10 of the forecast for
Q106: If the data appears to be increasing
Q107: Listed below is the net sales in
Unlock this Answer For Free Now!
View this answer and more for free by performing one of the following actions

Scan the QR code to install the App and get 2 free unlocks

Unlock quizzes for free by uploading documents