Listed below is the net sales in $ million for Home Depot Inc., and its subsidiaries from 1994 to
2003. 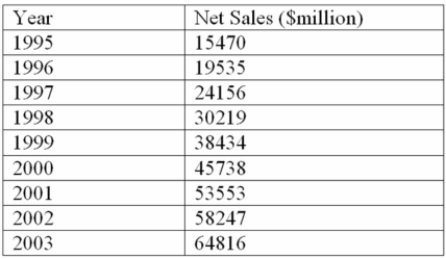
Using the printout below, what are the estimated sales for 2006? 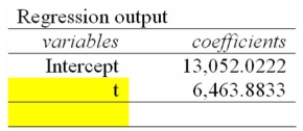
A) $90,618.6 Million
B) $477,690.9 Million
C) $84,154.7 Million
D) $103,546.4 Million
E) $71,227.0 Million
Correct Answer:
Verified
Q59: If a quarterly seasonal index is 0.56,
Q114: Listed below is the net sales in
Q116: A plastics manufacturing performed a quarterly time
Q117: Listed below is the net sales in
Q118: What is the general equation for the
Q120: Listed below is the net sales in
Q121: i. The reason for deseasonalizing a sales
Q122: i. For a quarterly time series, the
Q123: i. The cyclical component of a time
Q124: i. In the ratio-to-moving-average procedure, using the
Unlock this Answer For Free Now!
View this answer and more for free by performing one of the following actions

Scan the QR code to install the App and get 2 free unlocks

Unlock quizzes for free by uploading documents