The table below shows the sales for a plastics manufacturer recorded over the past year. The
Seasonal indexes for each quarter are also provided. To track the trend for these four quarters, use
The indexes to deseasonalize the sales data. 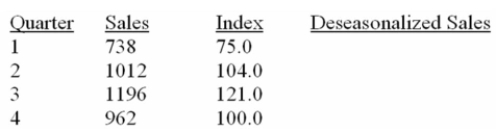
What are deseasonalized sales for quarter 1?
A) 553.5
B) 984.0
C) 1291.5
D) 184.5
E) 922.5
Correct Answer:
Verified
Q125: i. The ratio-to-moving-average method eliminates the seasonal,
Q126: i. Each typical seasonal index is a
Q127: i. Using the ratio-to-moving-average method, dividing the
Q128: Teton Village contains shops, restaurants and motels.
Q129: The table below shows the sales for
Q131: i. In the final step, using the
Q132: i. The irregular component of a time
Q133: i. The ratio-to-moving average method removes the
Q134: i. In the ratio-to-moving-average procedure, using the
Q135: i. A typical monthly seasonal index of
Unlock this Answer For Free Now!
View this answer and more for free by performing one of the following actions

Scan the QR code to install the App and get 2 free unlocks

Unlock quizzes for free by uploading documents