Use the scatter diagrams to verify which statements are correct:
Chart A 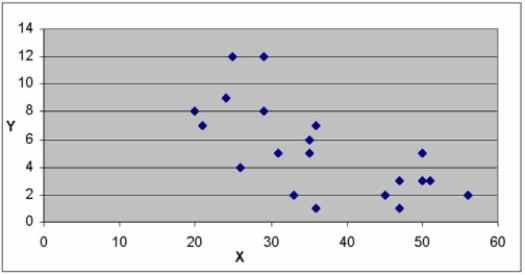
Chart B 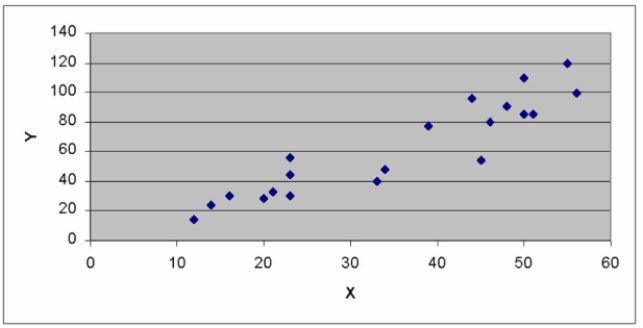
Chart C 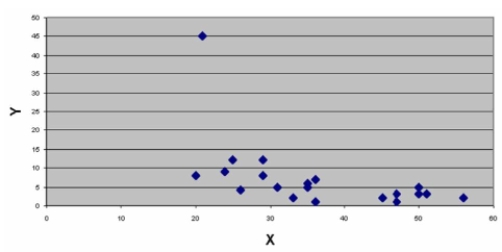
A) The variables in Chart A have a strong positive correlation.
B) The variables in Chart C have a strong positive correlation.
C) The variables in Chart B have a negative correlation.
D) Charts A & B have no obvious outliers.
Correct Answer:
Verified
Q61: What is the difference between a confidence
Q62: i. A coefficient of correlation r close
Q63: i. The purpose of correlation analysis is
Q64: i. The coefficient of correlation is a
Q65: What is the range of values for
Q67: i. A correlation coefficient of -1 or
Q68: i. Perfect correlation means that the scatter
Q69: What does a coefficient of correlation of
Q70: i. Correlation analysis is a group of
Q71: Which of the following statements regarding the
Unlock this Answer For Free Now!
View this answer and more for free by performing one of the following actions

Scan the QR code to install the App and get 2 free unlocks

Unlock quizzes for free by uploading documents