A random sample of 30 executives from companies with assets over $1 million was selected and
Asked for their annual income and level of education. The following table summarized the results: 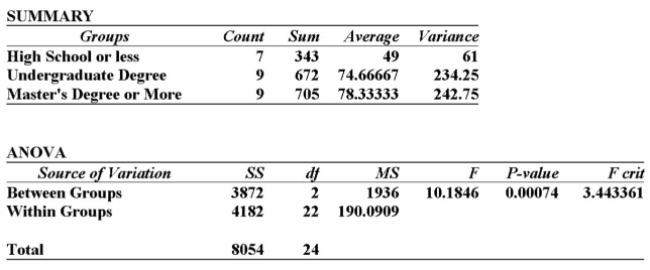
Using this output, what conclusions can you draw?
A) Since the calculated F-value is smaller than the F-critical value, there is a significant difference in the incomes of these 3 groups.
B) Since the calculated F-value is smaller than the F-critical value, there is no significant difference in the incomes of these three groups.
C) Since the P-value is 0.001, there is a 10% chance of these results happening when there is no significant difference in the incomes of these three groups.
D) Since the calculated F-value is larger than the F-critical value, and the P-value is so small, there is strong evidence to suggest that the three groups with different levels of education
Do not all have the same incomes.
E) Since the calculated F-value is larger than the F-critical value, and the P-value is so small, there is strong evidence to suggest that all three groups with different levels of education
Correct Answer:
Verified
Q1: An F-statistic is _.
A)a ratio of two
Q20: Two accounting professors decided to compare the
Q21: Two accounting professors decided to compare the
Q22: Two accounting professors decided to compare the
Q23: Two accounting professors decided to compare the
Q26: i. The statistical technique used to test
Q27: i. To employ ANOVA, the populations need
Q28: i. To employ ANOVA, the populations should
Q29: Two accounting professors decided to compare the
Q31: Which one of the following is not
Unlock this Answer For Free Now!
View this answer and more for free by performing one of the following actions

Scan the QR code to install the App and get 2 free unlocks

Unlock quizzes for free by uploading documents