The following graph shows the domestic supply and demand curves for a good. S1 and S2 represent the domestic industry supply before and after the provision of a subsidy by the government respectively, while D represents the domestic demand for the product. Prior to the subsidy, the country was importing 300 units of the good. Refer to the graph to answer the question. 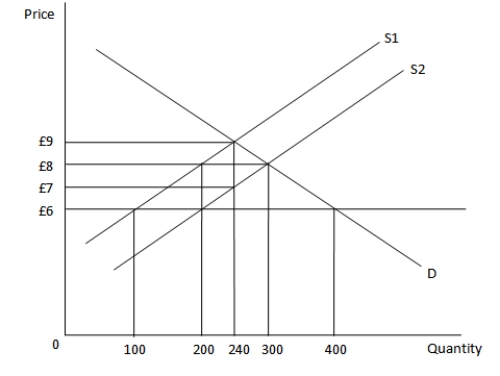 Which of the following is true once the subsidy is implemented?
A) The domestic supply curve shifts and the quantity supplied increases to 300 units.
B) The world price changes to £8 per unit.
C) The domestic demand remains unchanged at 400 units.
D) The quantity of imports increases.
Correct Answer:
Verified
Q19: Suppose that the nation of Rubium has
Q20: Suppose the nation of Lathania requires 10
Q21: Which of the following forms of trade
Q22: The following graph shows the domestic supply
Q23: The following graph shows the domestic supply
Q25: The following graph shows the domestic supply
Q26: When a tariff is removed this will
Q27: Suppose the world price of a good
Q28: The following graph shows the domestic supply
Q29: Membership of the EU requires a country
Unlock this Answer For Free Now!
View this answer and more for free by performing one of the following actions

Scan the QR code to install the App and get 2 free unlocks

Unlock quizzes for free by uploading documents