In the following graph, MPC and MSC represent the marginal private cost and marginal social cost of producing a good respectively. QD represents the demand for the good. Refer to the graph to answer the question. 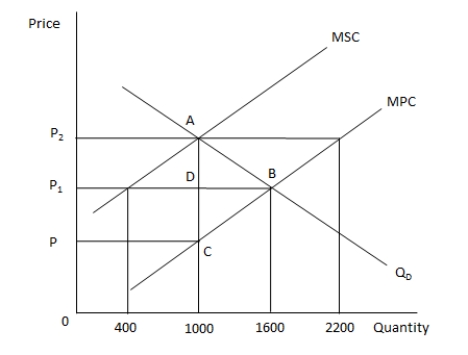 The private firm will maximize profits by producing _____ of the good.
A) 1000 units
B) 400 units
C) 1600 units
D) 2200 units
Correct Answer:
Verified
Q26: If either consumers or producers have incomplete
Q27: In the following graph, MPC and MSC
Q28: Which of the following is likely to
Q29: Which of the following is true of
Q30: Market failure is likely in markets that:
A)
Q32: Which of the following is true of
Q33: Pareto e?ciency is achieved when:
A) producers are
Q34: When would stock options offered to an
Q35: When there is an externality in the
Q36: Pareto e?ciency holds in a(n) _.
A) monopoly
B)
Unlock this Answer For Free Now!
View this answer and more for free by performing one of the following actions

Scan the QR code to install the App and get 2 free unlocks

Unlock quizzes for free by uploading documents