In the following graph, MPC and MSC represent the marginal private cost and marginal social cost of producing a good respectively. QD represents the demand for the good. Refer to the graph to answer the question. 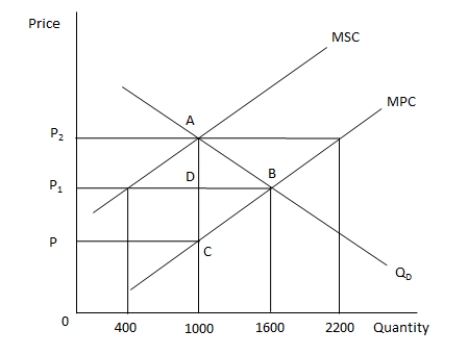 The amount of tax that the government should levy to bring output to the socially optimum level is equal to the distance between the points _____.
A) A and B
B) B and D
C) B and C
D) A and C
Correct Answer:
Verified
Q36: Pareto e?ciency holds in a(n) _.
A) monopoly
B)
Q37: When _, there is market failure.
A) the
Q38: A Pareto e?cient outcome is one where:
A)
Q39: If the marginal private cost of a
Q40: Which of the following is true of
Q42: Which of the following is an example
Q43: Which of the following is true of
Q44: Under the European system of carbon emissions
Q45: In the following graph, MR and AR
Q46: Which of the following is a function
Unlock this Answer For Free Now!
View this answer and more for free by performing one of the following actions

Scan the QR code to install the App and get 2 free unlocks

Unlock quizzes for free by uploading documents