In the following graph, MR and AR represent the marginal revenue and average revenue curves of a monopoly firm respectively. MC represents the marginal cost curve of the firm. Refer to the graph to answer the question. 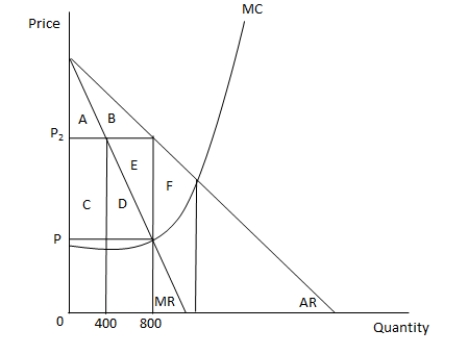 When the price in the market is P2, producer surplus is equal to the area _____.
A) A + B
B) C + D + E
C) E + F
D) F
Correct Answer:
Verified
Q47: Which of the following statements is true?
A)
Q48: Which of the following is a drawback
Q49: In the following graph, MR and AR
Q50: An increase in the cost of obtaining
Q51: In the following graph, MR and AR
Q53: Which of the following is an example
Q54: When the supply of a good is
Q55: Which of the following measures by the
Q56: If a competitive market becomes a monopoly
Q57: The environmental Kuznets curve shows:
A) a direct
Unlock this Answer For Free Now!
View this answer and more for free by performing one of the following actions

Scan the QR code to install the App and get 2 free unlocks

Unlock quizzes for free by uploading documents