The following graph shows the marginal revenue (MR) , average revenue (AR) , marginal cost (MC) and average cost (AC) curves for an oligopoly ?rm. Refer to the graph to answer the question. 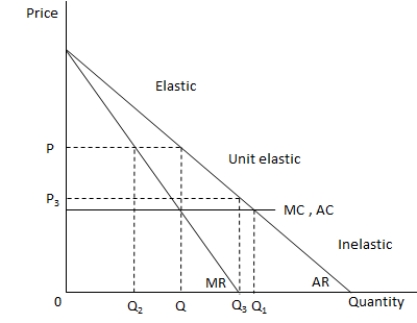
Assume that all the ?rms in the oligopoly market face the same set of cost and revenue curves. If they formed a cartel, they would maximize pro?t at the output level _____.
A) Q
B) Q1
C) Q2
D) Q3
Correct Answer:
Verified
Q31: Which of the following is true of
Q32: Suppose a cartel operates in the widget
Q33: A cartel is more likely to be
Q34: A problem often encountered when oligopolists try
Q35: The following table shows the pay-off matrix
Q37: Oligopolists collude in order to_.
A) minimize the
Q38: The following graph shows the marginal revenue
Q39: The following table shows the pay-off matrix
Q40: The kinked demand curve pricing model is
Q41: Which of the following auction formats offers
Unlock this Answer For Free Now!
View this answer and more for free by performing one of the following actions

Scan the QR code to install the App and get 2 free unlocks

Unlock quizzes for free by uploading documents