The following graph shows the marginal revenue (MR) , marginal cost (MC) , demand and average revenue (D = AR) curves for a profit-maximizing firm. Refer to the graph to answer the question. 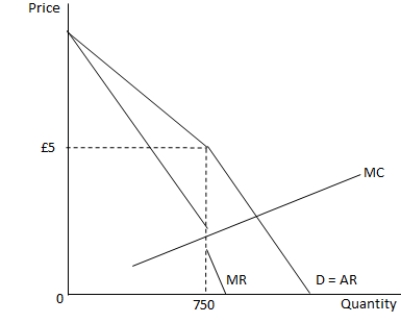 Which of the following statements is true?
A) The firm is a price leader in this market.
B) Firms in this market produce highly differentiated products.
C) A small change in the marginal cost will lead to a large change in the equilibrium price.
D) Below the market price, the demand curve is price inelastic.
Correct Answer:
Verified
Q17: Suppose the market share of the five
Q18: In the long run, tangency equilibrium occurs
Q19: What is meant by the strategic interdependence
Q20: Which of the following is a characteristic
Q21: A drawback of the kinked demand curve
Q23: Suppose that five firms in an oligopoly
Q24: Suppose that all the firms in an
Q25: Suppose that it is relatively easy for
Q26: To move from a non-co-operative Nash equilibrium
Q27: In the kinked demand curve model, the
Unlock this Answer For Free Now!
View this answer and more for free by performing one of the following actions

Scan the QR code to install the App and get 2 free unlocks

Unlock quizzes for free by uploading documents