The following graph shows the demand (QD) and supply (QS) curves in the market for good X. Refer to the graph to answer the question: 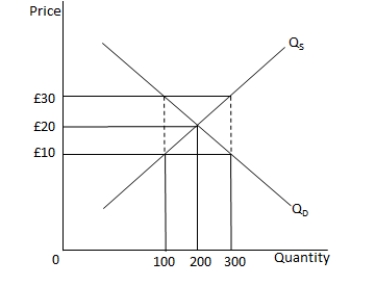 At a market price of £20, _____.
A) the quantity supplied in the market is equal to 200 units
B) the seller is willing to supply more than what the consumers are willing to buy
C) the seller will reduce the price until the excess stock is sold
D) there is a shortage of good X
Correct Answer:
Verified
Q3: Suppose butter and margarine are used as
Q4: Suppose the market for wheat is in
Q5: Suppose bad weather adversely affects coffee plantations
Q6: If the prices of the factors of
Q7: Suppose that erasers and pencils are complements.
Q9: When a market is in equilibrium, _.
A)
Q10: A change in the demand for a
Q11: Suppose there are two goods X and
Q12: Excess demand exists in a market when:
A)
Q13: Which of the following statements is assumed
Unlock this Answer For Free Now!
View this answer and more for free by performing one of the following actions

Scan the QR code to install the App and get 2 free unlocks

Unlock quizzes for free by uploading documents