In the following graph, QS1 and QS2 represent the supply curves and QD1 and QD2 represent the demand curves. Refer to the graph to answer the question: 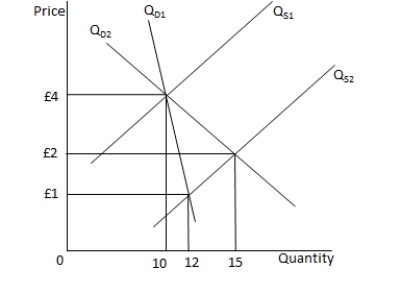
Which of the following statements is true?
A) The demand curve QD1 is more elastic than the demand curve QD2.
B) The supply curve QS1 is less elastic than the supply curve QS2.
C) An increase in supply will lead to a relatively smaller change in output along QD1.
D) A decrease in supply from QS2 to QS1 will lead to a fall in the market price.
Correct Answer:
Verified
Q30: Formula 1 (F1) motor racing strictly controls
Q31: Assuming that demand is unchanged, an increase
Q32: If the trade union in a factory
Q33: The elasticity of supply is a measure
Q34: Suppose the demand for furniture remains constant.
Q36: Other things constant, the supply of wheat
Q37: If there is a surplus of a
Q38: The supply curve for a good will
Q39: In the following graph, QS and QD
Q40: Assuming that the demand for cars is
Unlock this Answer For Free Now!
View this answer and more for free by performing one of the following actions

Scan the QR code to install the App and get 2 free unlocks

Unlock quizzes for free by uploading documents