In the following graph, QS1 and QS2 represent the supply curves and QD1 and QD2 represent the demand curves. Refer to the graph to answer the question: 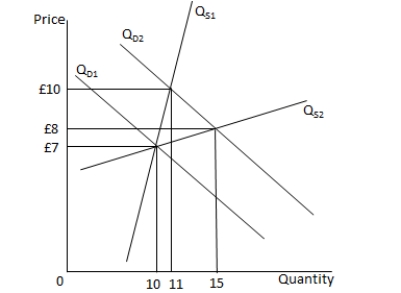
Which of the following statements is true?
A) The supply curve QS1 is elastic and QS2 is inelastic.
B) As price increases along the supply curve QS1, output will increase more than
C) An increase in demand will lead to a relatively larger change in output along QS2.
D) A decrease in demand from QD2 to QD1 leads to a rise in the equilibrium price.
Correct Answer:
Verified
Q22: The quantity of corn supplied to the
Q23: With a given demand curve, an increase
Q24: In the following graph, QS and QD
Q25: If a firm faces a relatively inelastic
Q26: In a free market, a shortage of
Q28: The supply curve for a good will
Q29: In which of the following cases is
Q30: Formula 1 (F1) motor racing strictly controls
Q31: Assuming that demand is unchanged, an increase
Q32: If the trade union in a factory
Unlock this Answer For Free Now!
View this answer and more for free by performing one of the following actions

Scan the QR code to install the App and get 2 free unlocks

Unlock quizzes for free by uploading documents