In the following graph, QS and QD represent the supply and the demand curves respectively. Refer to the graph to answer the question. 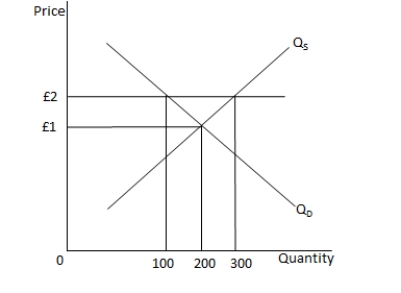
If the minimum price of the good is set at £2, which of the following is likely to happen?
A) The minimum price will not affect quantity demanded or supplied as it is set above the equilibrium price.
B) The total quantity of the good bought and sold in the market will be equal to 200 units.
C) There will be a surplus of 200 units in the market.
D) The imports of the good will increase.
Correct Answer:
Verified
Q45: Which of the following is true for
Q46: In the above graph, QS and QD
Q47: In the following graph, QS and QD
Q48: The quantity demanded of good X in
Q49: If the price floor for a good
Q51: Which of the following is true for
Q52: Which of the following is a feature
Q53: In the following graph, QS1 is the
Q54: If it is difficult to differentiate between
Q55: Suppose firms are able to hire labour
Unlock this Answer For Free Now!
View this answer and more for free by performing one of the following actions

Scan the QR code to install the App and get 2 free unlocks

Unlock quizzes for free by uploading documents