The following graph shows a downward-sloping demand curve for a good. Refer to the graph to answer the question. 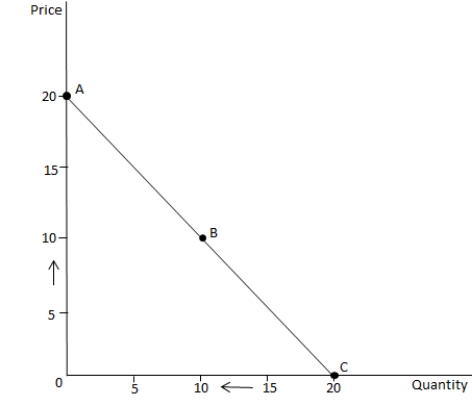
The price elasticity of demand at point A is equal to _____.
A) 1
B) 0
C) ?
D) 3
Correct Answer:
Verified
Q19: When the demand for a good increases:
A)
Q20: If goods J and K are substitutes,
Q21: If the demand curve for corn is
Q22: Suppose the price elasticity of demand for
Q23: The price elasticity of demand for a
Q25: Which of the following correctly states the
Q26: If the percentage change in the price
Q27: If the percentage change in the price
Q28: Which of the following will affect a
Q29: An advertising campaign for a good that
Unlock this Answer For Free Now!
View this answer and more for free by performing one of the following actions

Scan the QR code to install the App and get 2 free unlocks

Unlock quizzes for free by uploading documents