The shaded bars in the histogram below represent the times (rounded to the nearest 10 milliseconds) that 50 people take to react to a loud noise.Which of the following statements is true? 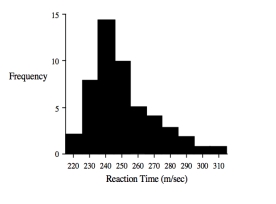
A) The distribution of reaction times is positively skewed.
B) The modal reaction time is 250 ms.
C) The median reaction time is less than 250 ms.
D) The mean reaction time will be less than the modal reaction time.
E) The mean is an unambiguous measure of central tendency.
Correct Answer:
Verified
Q8: This question relates to the output below:
Q9: This question relates to the output below:
Q10: This question relates to the output below:
Q11: This question relates to the output below:
Q12: This question relates to the output below.Looking
Q14: A teacher conducts a study in which
Q15: Which of the following statements is likely
Q16: "Numerical statements about the properties of some
Q17: This question relates to the output below.Here
Q18: This question relates to the output below:
Unlock this Answer For Free Now!
View this answer and more for free by performing one of the following actions

Scan the QR code to install the App and get 2 free unlocks

Unlock quizzes for free by uploading documents