(Figure: Consumption with and without Trade) Refer to the figure. Suppose this diagram represents the market for sugar in the United States. 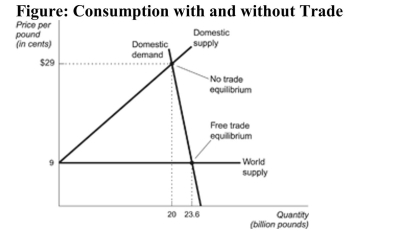 a. What is the equilibrium price of sugar before trade? b. What is the equilibrium quantity of sugar before trade? c. What is the price of sugar after trade is allowed? d. What is the quantity of sugar imported after trade is allowed? e. What is the amount of consumer surplus before trade? f. By how much does consumer surplus increase after trade? g. What is the amount of producer surplus before trade? h. What is the amount of producer surplus after trade?
Correct Answer:
Verified
View Answer
Unlock this answer now
Get Access to more Verified Answers free of charge
Q152: Economic benefits to tariffs and import quotas
Q161: In a demand and supply diagram, the
Q167: A tariff benefits domestic producers but hurts
Q169: There is strong evidence to support the
Q179: Removing tariffs and quotas will ensure that
Q187: What are the three major benefits of
Q189: What are the gains and losses of
Q190: Economic growth requires job destruction, since the
Q191: What are the arguments in favor of
Q195: Briefly discuss any benefits of "protectionism".
Unlock this Answer For Free Now!
View this answer and more for free by performing one of the following actions

Scan the QR code to install the App and get 2 free unlocks

Unlock quizzes for free by uploading documents