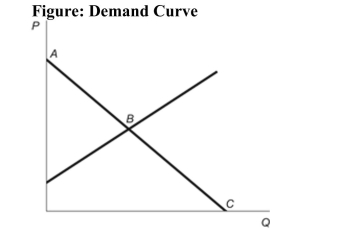
 Reference: Ref 7-1 (Figure: Demand Curve) Refer to the figure. Which point on the graph represents an unsatisfied want?
A) Point B
B) Point A and Point B
C) Point A
D) Point C
Correct Answer:
Verified
Q21: Central planning of resource allocation:
A) was attempted
Q22: From the chapter discussion, why did increased
Q23: Markets are advantageous over central planning as
Q23: The equilibrium price in the market represents
Q25: The Strike King Lure Co. ordered $100,000
Q26: Suppose that a war in the Middle
Q27: Higher oil prices represent higher energy costs
Unlock this Answer For Free Now!
View this answer and more for free by performing one of the following actions

Scan the QR code to install the App and get 2 free unlocks

Unlock quizzes for free by uploading documents