Multiple Choice
(Figure: Demand-Driven Price Change) Refer to the figure. When the demand curve shifts from D0 to D1, the equilibrium price rises to: 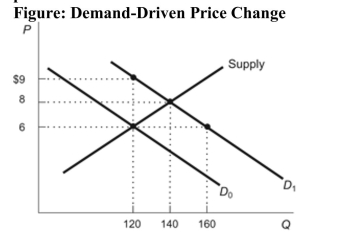
A) $9 and the equilibrium quantity rises to 120.
B) $9 and the equilibrium quantity rises to 160.
C) $8 and the equilibrium quantity rises to 140.
D) $8 and the equilibrium quantity rises to 160.
Correct Answer:
Verified
Related Questions
Q7: Q8: (Figure: Supply-Driven Price Change) Refer to the Q9: Suppose that a market is characterized as![]()

