(Figure: Supply Shift) In the figure, the supply curve shifted from S0 to S1. To describe this movement, we would say that: Figure: Supply Shift 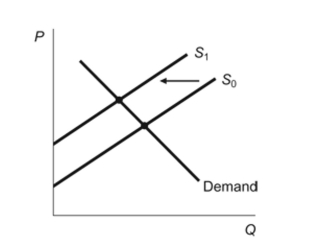
A) demand decreased, which caused a decrease in supply.
B) supply decreased, which caused a decrease in quantity demanded.
C) supply decreased, which caused a decrease in demand.
D) supply increased, which caused a decrease in quantity demanded.
Correct Answer:
Verified
Q64: (Figure: Demand Shift) In the figure, the
Q68: In a free market equilibrium, demand equals
Q71: After adjusting for inflation, a comparison of
Q83: An early frost in the vineyards of
Q105: Which of the following would NOT lead
Q107: Which of the following might explain why
Q141: When you move along a demand curve:
A)
Q166: Which choice explains how the OPEC crisis
Q173: Economic growth in China has led to
Q175: When Asian countries went into a recession
Unlock this Answer For Free Now!
View this answer and more for free by performing one of the following actions

Scan the QR code to install the App and get 2 free unlocks

Unlock quizzes for free by uploading documents