(Table: Changes in the National Debt) (This question is for those instructors who have spent some time in class discussing the evolution of the national debt, and the history of the federal budget deficits and surpluses.) 
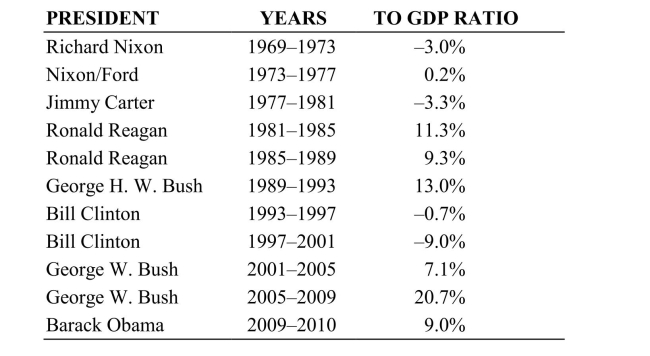 The chart (adapted from a chart on Wikipedia developed from the budget for the fiscal 2012 year) shows the change in federal debt by president, and the years of each administration. What helps to explain some of the increase seen in the Reagan years?
Correct Answer:
Verified
View Answer
Unlock this answer now
Get Access to more Verified Answers free of charge
Q91: Which of the following is TRUE of
Q104: Corporations ultimately bear the entire burden of
Q121: What kinds of tax deductions are described
Q122: What is a flat tax? What are
Q123: Social Security benefits have become less generous
Q125: It is possible for a country to
Q145: Social Security operates on a "pay as
Q152: The deficit is all federal debt held
Q153: Explain the difference between Medicare and Medicaid.
Q160: The national debt held by the public
Unlock this Answer For Free Now!
View this answer and more for free by performing one of the following actions

Scan the QR code to install the App and get 2 free unlocks

Unlock quizzes for free by uploading documents